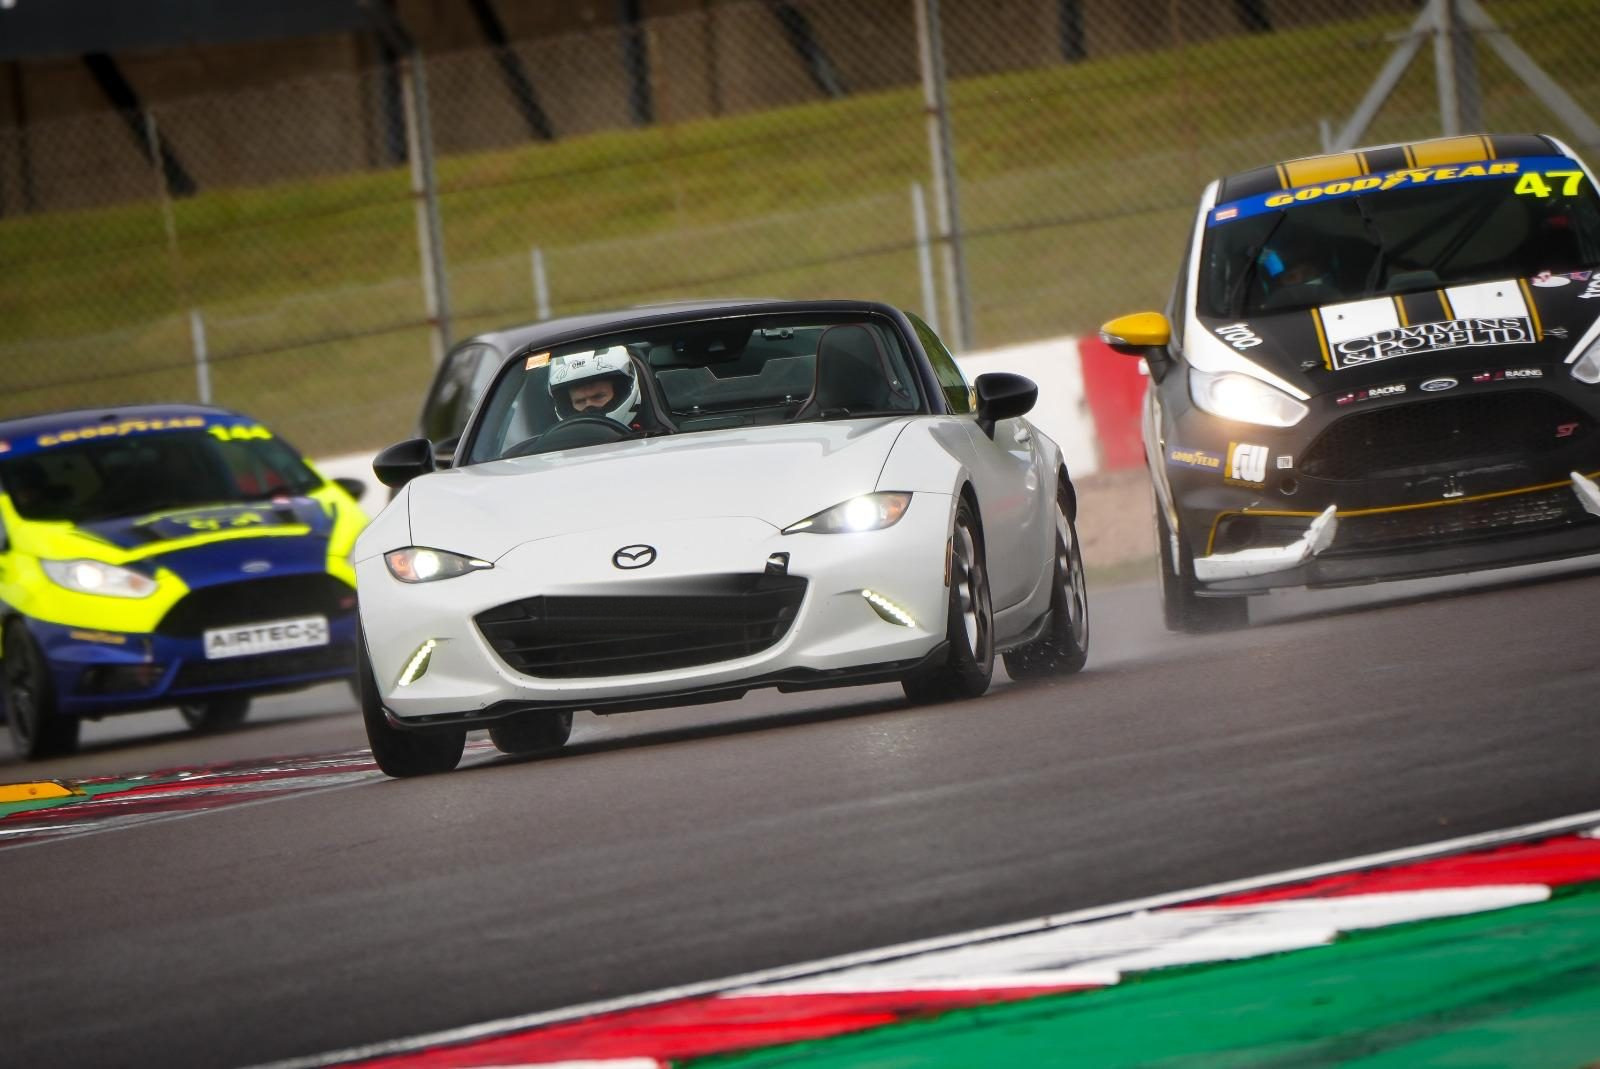
Proven on the road, verified on the rollers.
We have spent hours on the road dialling in our maps on the Skyactiv platform, and then verified our results on the dyno.
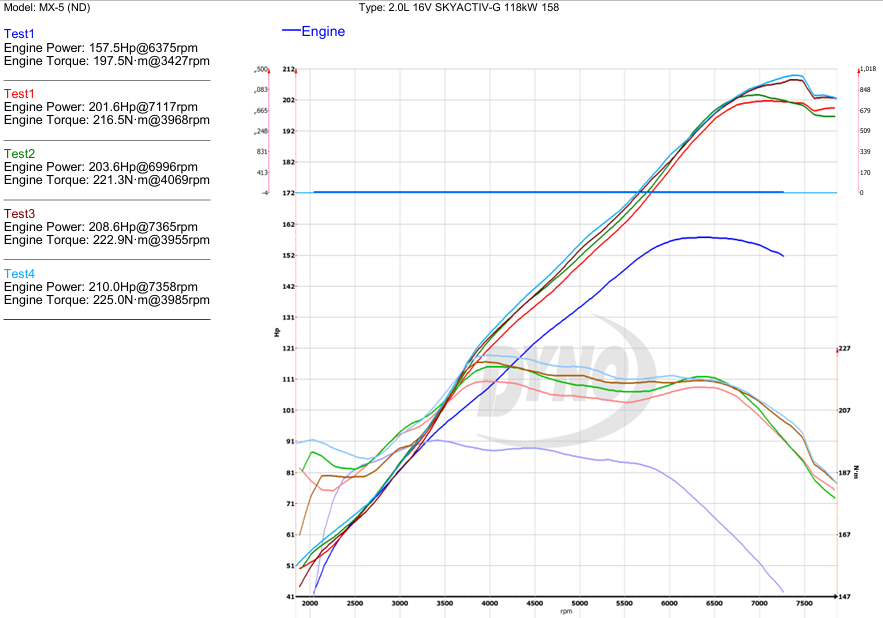
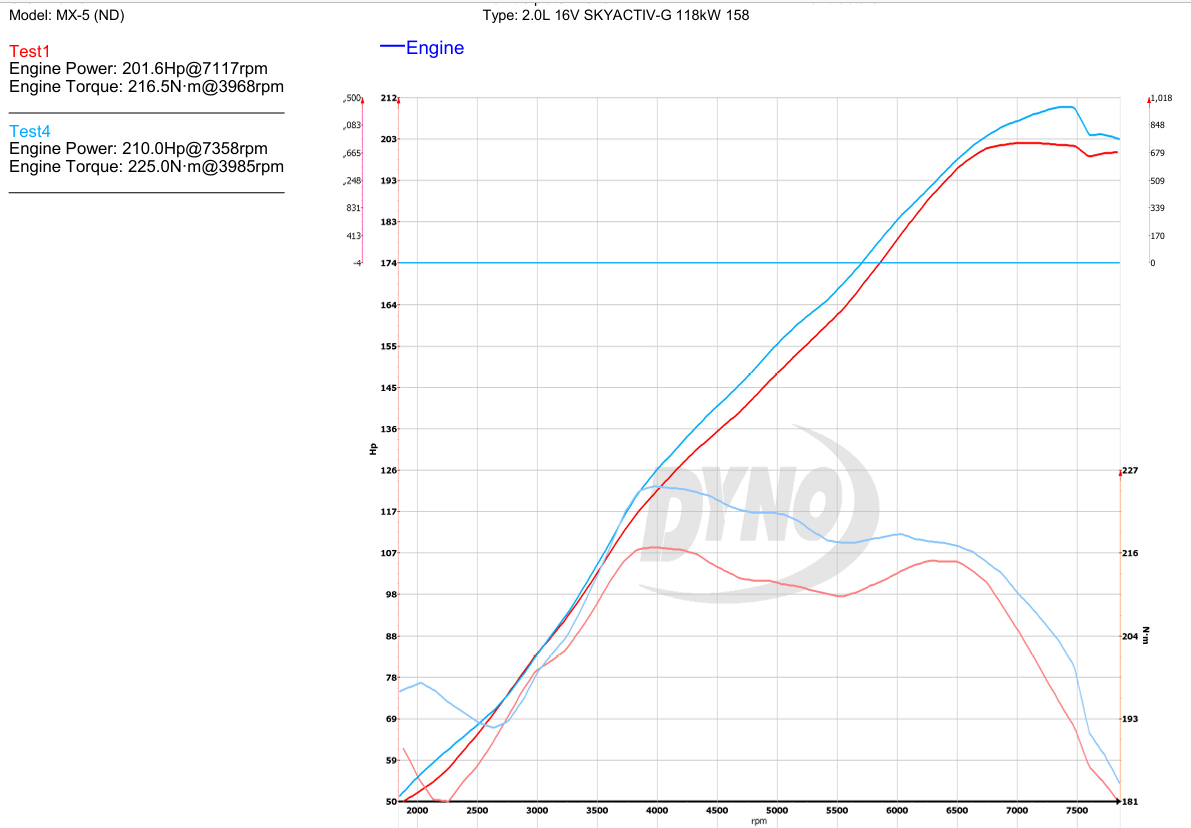
Here are a selection of the charts we have produced so far.
The test mule
Maps on the ND are verified on our test mule, which has gone from bog standard to an ND1/ND2 hybrid with cams and other goodies. It is quite a bespoke build, so when we felt we were not getting the right output, we took the reins and developed our own maps.
What the OEM strategy costs you
The OEM map strategy on the Skyactiv is to limit torque by cam positions and ignition, and if airflow changes beyond a ceiling, the throttle is artificially closed.
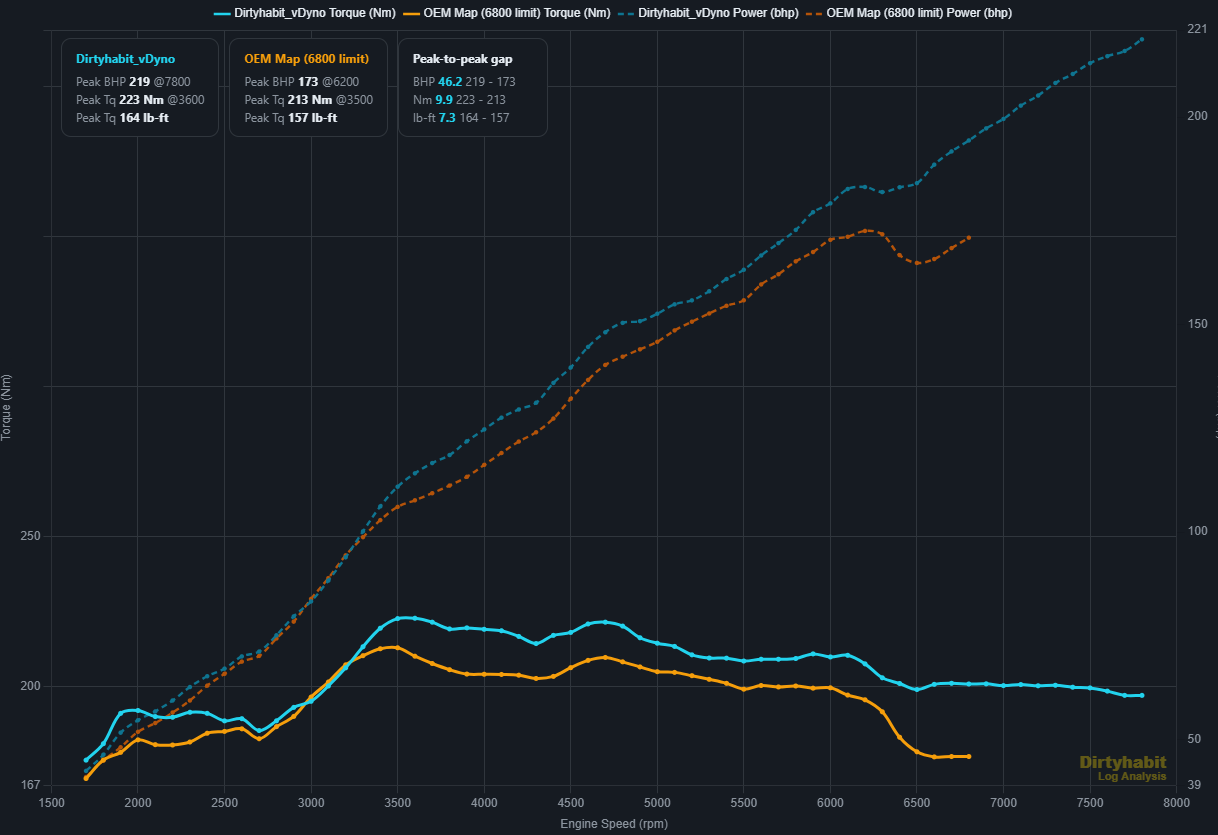
Peak power lost by putting the factory map back on a fully modified engine.
Without doubt this gives you an indication of the limits of the OEM mapping strategy. The redline and the cam phasing just are not good enough.
Every naturally aspirated bolt-on has been fitted to this car — intake, head swap, larger valves, cams, headers, sports cat — and it netted about the same total gain as a remap from us would have got you by itself.
Consultation and log analysis
If you would simply like some help diagnosing a problem, or want a better view into how your car is performing, we can run your logs through our proprietary software. We have already done this for self-tuning customers to identify issues with ignition timing, AFR problems, and to adjust MAF scaling for correct fuel trims.
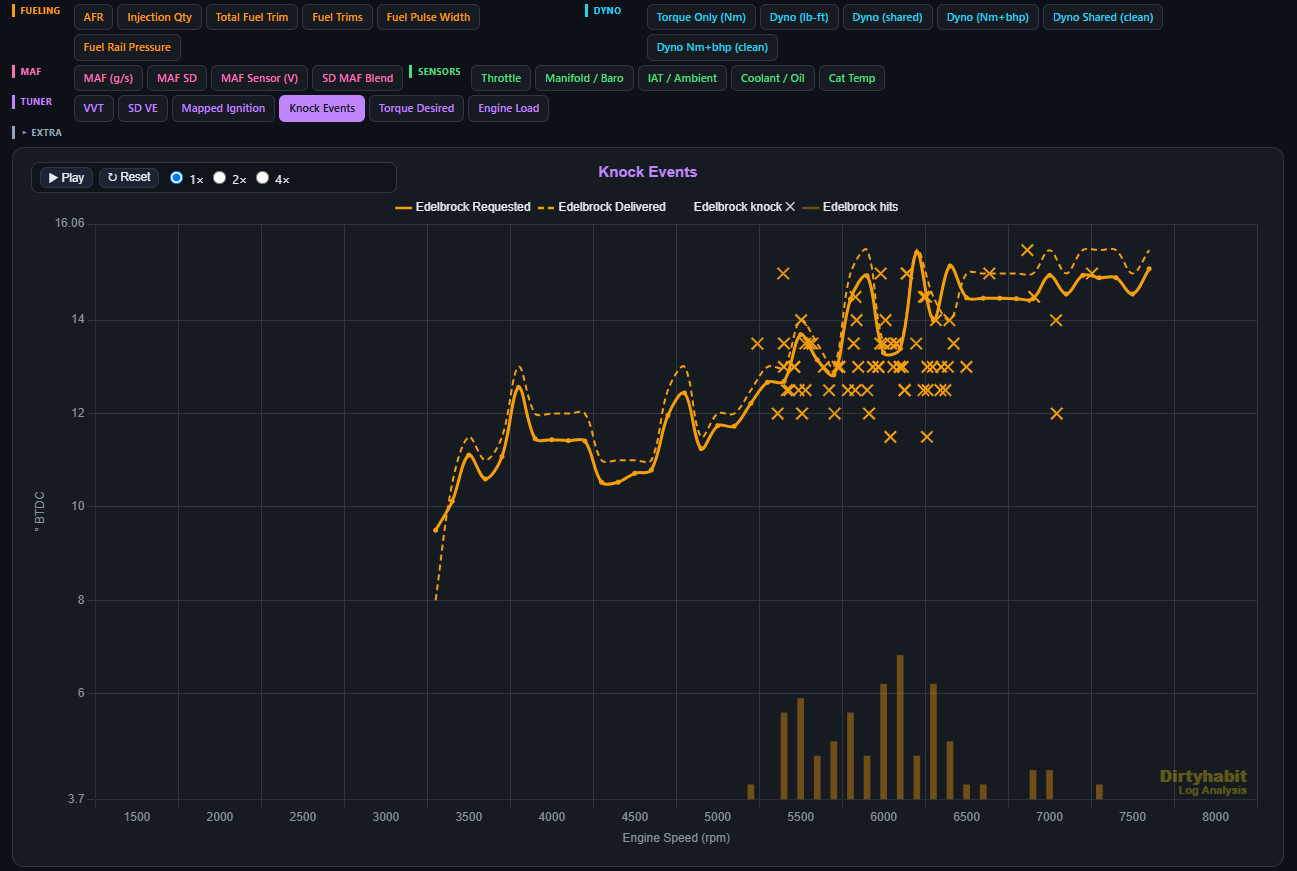
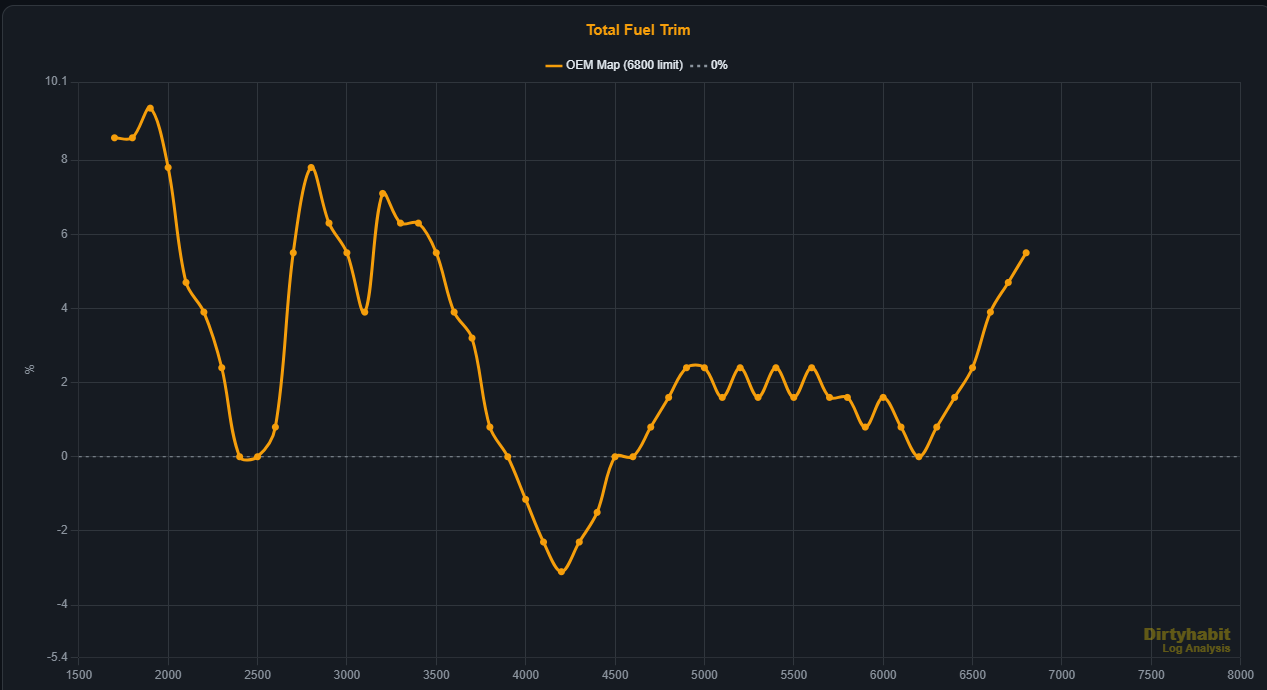
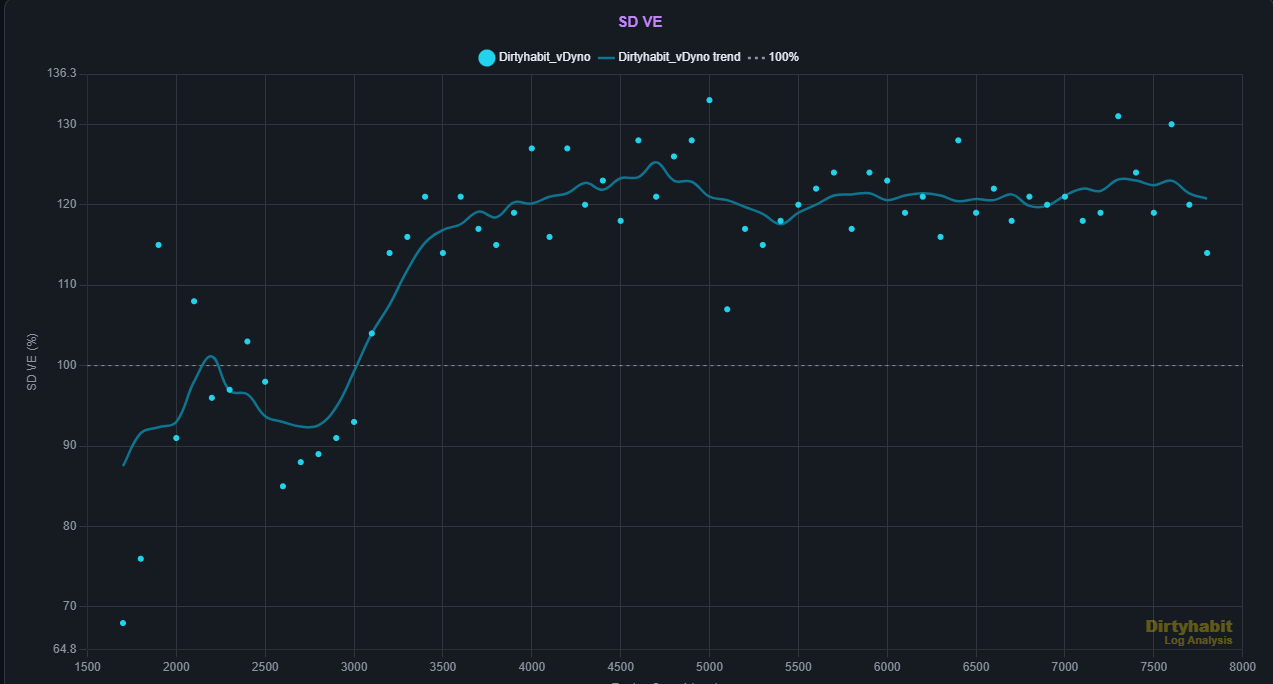
Whether you are self-tuning your own ECU with any brand of software, or you have a map from someone else and just want to see the trends and behaviours, this can be a great way to get visibility.
Want this for your car?
Let’s talk!